This test assesses how easy it is to access and run a UFS code, modify a physics parameter, re-run the code and then compare results. The test case is a hurricane Dorian simulation using the UFS Medium-Range Weather Application. It is an example of a code usability evaluation following the “Graduate Student Test” protocol developed for the Unified Forecast System (UFS). After completing the technical exercise, participants submit feedback on their experience through a short questionnaire. You don’t have to be a graduate student to take the test – all feedback is appreciated. If you would like to take the test and submit your feedback, please register here.
In order to perform the test, you will run the Medium-Range Weather Application for 48 hours, use the workflow software to make a change to the namelist that increases the concentration of cloud condensation nucleii (CCN), and perform another 48 hour run with this change. Then you will compare the total cloud cover field before and after the change. (Note: If you are using a laptop for the test, running a 48 hour simulation will likely take a few hours. You may wish to run 12 hour simulations instead. Plots of output both 48 and 12 hour simulations are provided below for comparison.)
Cloud condensation nuclei (CCN) are small particles suspended in the atmosphere on which water vapor condenses. The number of nuclei per cubic centimeter is used in the microphysics parameterization. With more CCN in the air, cloud water is distributed over a larger number of smaller drops. This hinders the development of precipitation processes, so droplets stay suspended and cloud coverage is higher. Even after just 48 hours, an increase can be seen in the cloud cover field. As the forecast progresses, nonlinear processes take place and can change this simple interpretation.
Run the Control Case
Follow the instructions on the Getting Started page to run the Hurricane Dorian case at C96 resolution, with the GFSv15p2 physics, for 48 hours. Please check the MRW forum if you run into technical issues. A solution to your issue may already have been addressed. If not, open a new topic. The forum can be accessed here.
Run the Experiment
You will need to create another case directory for the experiment, and setup the new case.
$ cd $HOME/my_ufs_sandbox/cime/scripts
$ ./create_newcase --case DORIAN_C96_GFSv15p2_EXP --compset GFSv15p2 --res C96 --workflow ufs-mrweather
$ cd DORIAN_C96_GFSv15p2_EXP
$ ./case.setup
At this point, you can see the current values for CCN (ccn_o = 100 and ccn_l = 300) by looking at the input.nml file in the control run:
$ more $SCRATCH/DORIAN_C96_GFSv15p2/run/input.nmlYou will set the values through the workflow:
$ cd $HOME/my_ufs_sandbox/cime/scripts/DORIAN_C96_GFSv15p2_EXPUse your editor to append the following to the entries in the file user_nl_ufsatm
ccn_l = 900.
ccn_o = 300.
Next you will build the case:
$ ./case.buildOnce that completes, change the run duration to 48 hours and reduce the time request. Then submit the case.
$ ./xmlchange STOP_OPTION=nhours,STOP_N=48
$ ./xmlchange JOB_WALLCLOCK_TIME=00:45:00
$ ./xmlchange USER_REQUESTED_WALLTIME=00:45:00
$ ./case.submit
Once again, you should see the output files shown in Getting Started in the case run directory for the experiment:
$ ls $SCRATCH/DORIAN_C96_GFSv15p2_EXP/runCompare outputs
Changing the concentration of CCN creates a noticeable difference in the total cloud cover. Now that you've completed both runs compare the total cloud cover before and after the CCN change.
You can look at the difference using NCL. If you haven't yet loaded the modulefiles for NCL, look at the Check Your Results section of the Getting Started page.
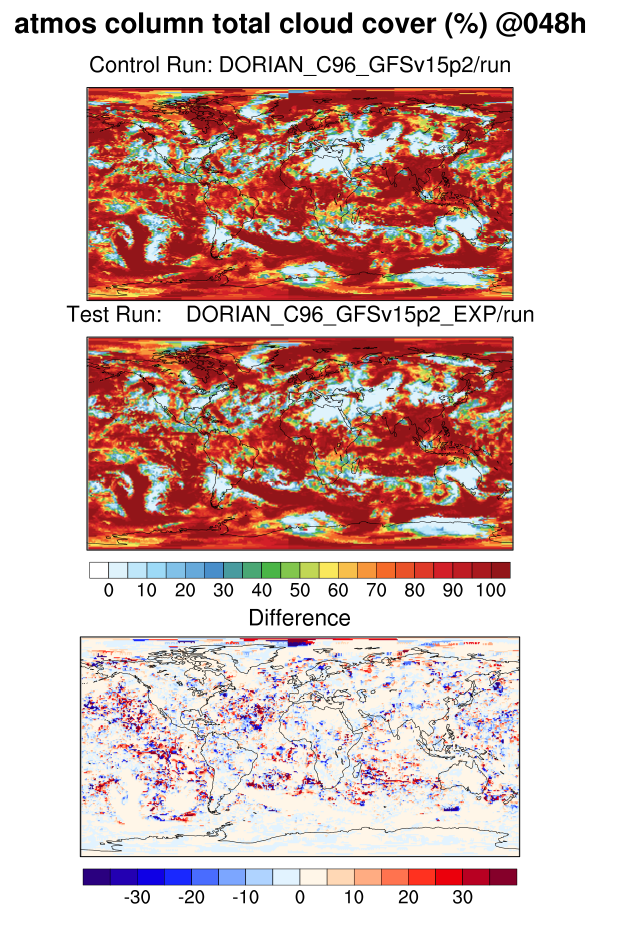
We are providing a script that plots the differences between control and test runs for 2m temperature (tmp2m), total precipitation (tprcp), and atmospheric column total cloud cover (tcdc_aveclm) at 48h.
To get and run this NCL script execute the following commands. This script will produce png files for each variable being plotted. The argument "c=" is the control run directory, and "t=" is the test run directory. (If you are running the 12 hour simulation, you will need to change this parameter in the script.)
$ cd $SCRATCH
$ wget https://raw.githubusercontent.com/wiki/ufs-community/ufs-mrweather-app/files/plot_ufs_sfcf_diff.ncl
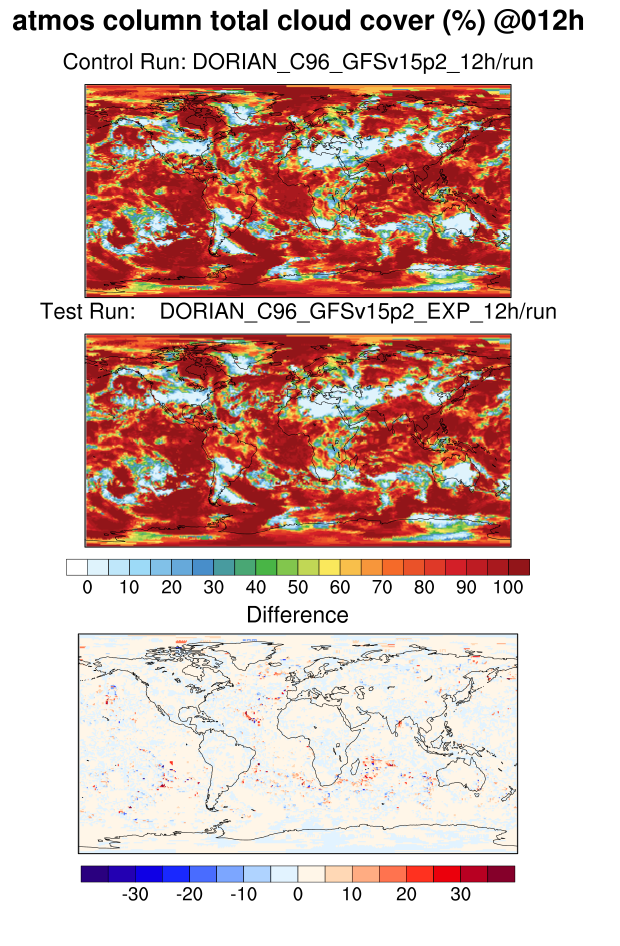
$ ncl plot_ufs_sfcf_diff.ncl 'c="DORIAN_C96_GFSv15p2/run"' 't="DORIAN_C96_GFSv15p2_EXP/run"'Your NCL output of atmospheric column total cloud cover difference should look like this:
Or, if you ran 12 hour simulations, like this: